As organizations embrace desktop virtualization and cloud services, IT environments grow increasingly complex – with highly distributed systems, containerized apps, and hybrid clouds all intertwined. Traditional network operations teams often find themselves in a constant firefight: chasing endless alerts at all hours, scrambling to fix outages, and struggling with limited visibility into what’s really happening across the network. The result is alert fatigue, avoidable downtime, and mounting risk to the business.
Moving from a reactive mindset to a resilient one isn’t just an IT upgrade – it’s a strategic necessity in today’s digital landscape.
Enterprise networks have become incredibly complex. The widespread adoption of cloud and microservices architectures means systems are highly interconnected and constantly changing. In fact, 94% of businesses now use cloud computing, and microservices have become commonplace – a trend that has caused digital infrastructure complexity to skyrocket. This complexity brings tool sprawl and “blind spots” where IT teams lack end-to-end visibility. It’s not uncommon for a network issue in one corner of the infrastructure to remain hidden until it cascades into a major outage, simply because the team didn’t have a clear line of sight.
At the same time, traditional monitoring tools are flooding teams with alerts. Every flicker in a performance metric triggers a notification, and many are false positives or low priority. This constant noise leads to “alert fatigue,” where engineers become overwhelmed and desensitized, increasing the chance that critical warnings get missed. We’ve heard war stories of midnight on-call engineers ignoring an alert storm, only to discover in the morning that one of those alerts was the early sign of a severe outage. It’s a humanly impossible task to triage thousands of alerts per week without smarter filtering.
The stakes for missing issues are extremely high. Network downtime and performance degradations directly hit the bottom line. Studies have found that the average cost of a critical application failure in 2024 is around $12,900 per minute. That’s over $750,000 per hour – and in many large enterprises the cost can run into millions when you factor in lost revenue, lost productivity, and damage to customer trust. Beyond the dollars, think about the frustration for users and customers when services are unavailable. In the era of e-commerce and 24×7 global operations, even a brief network outage can snowball into a public fiasco.
It’s clear that the old ways of working – manually monitoring a complex network with limited visibility and chasing alerts reactively – are no longer sustainable. Decision-makers planning desktop virtualization projects or overall network modernization must first acknowledge these pain points. Complexity, alert fatigue, downtime, and invisibility are dragging down IT teams and posing significant business risk. The good news is there’s a better way forward.

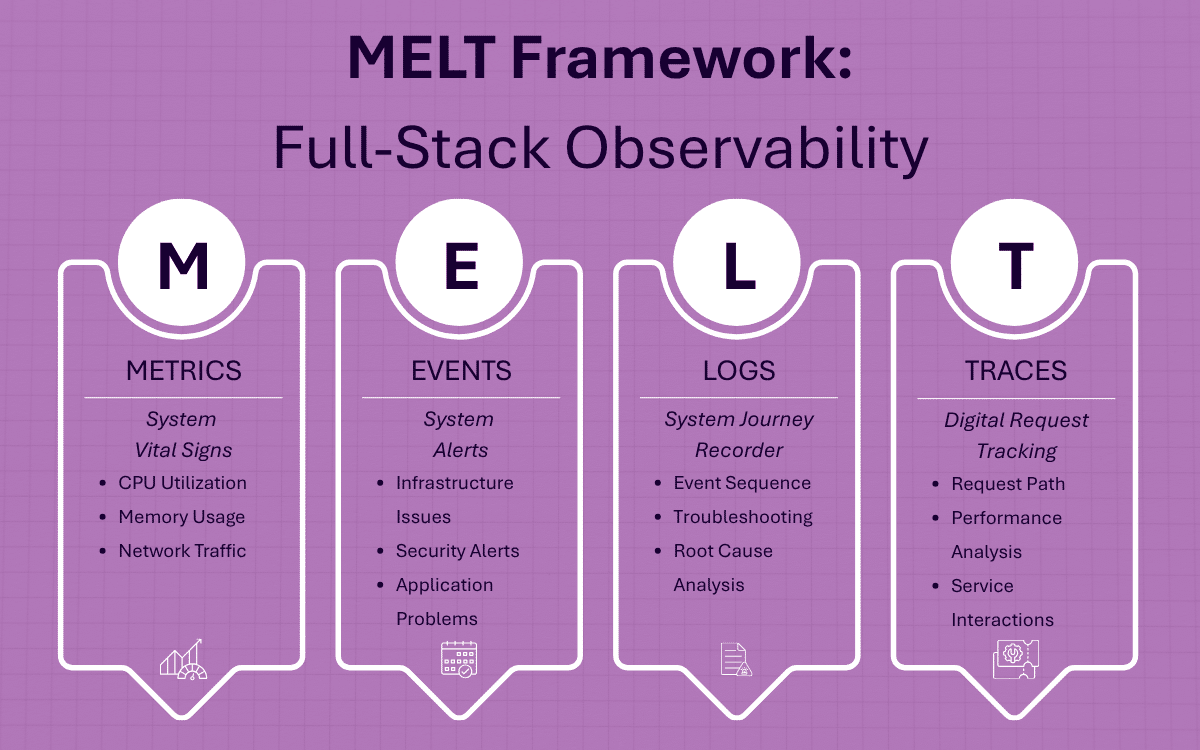
The MELT framework (Metrics, Events, Logs, Traces) represents the components of full-stack observability, providing deeper insight into system behavior beyond what traditional monitoring offers. Observability correlates telemetry from these sources to explain not just what is failing, but why.
The evolution of IT operations is often described as a shift from monitoring to observability. At a high level, traditional monitoring tells you what is happening – a server’s CPU is maxed out, a router is down – whereas observability helps explain why it’s happening and how to fix it. Classic monitoring relies on predefined metrics and up/down checks. It might alert you that network latency is high, but it won’t tell you whether the root cause is a misconfigured switch, a spike in database calls, or an external ISP issue.
Observability takes things further by correlating a wide range of telemetry (often summarized as Metrics, Events, Logs, and Traces – the MELT components) to provide a holistic, real-time view of system behavior. Instead of siloed data points, you get cross-domain insight. For example, an observability platform might correlate a surge in CPU (metric) with a specific error event and a set of log entries, pinpointing exactly which microservice and transaction trace caused the chain reaction. This context is gold for fast troubleshooting.
Why is observability so crucial now? Because modern environments are too complex and dynamic for manual monitoring alone. Increasing IT complexity (hybrid cloud, containers, remote desktops, etc.) has exposed the limitations of traditional monitoring tools. Perhaps most importantly, observability shifts teams from a reactive posture to a proactive and preventive stance. Industry research by McKinsey even found that embracing observability allowed a company to cut incidents by 90% and slash response times from hours to seconds. The message is clear: adopting observability isn’t just an IT trend, it’s now a business enabler for reliability.
Upgrading the tooling is one side of the coin – the other is rethinking processes and coverage. In a global, always-on enterprise, your network operations can’t afford to sleep. That’s why leading organizations invest in 24×7 Network Operations Center (NOC) coverage, often with dual NOCs in different regions for redundancy. We often say, “your enterprise never stops operating, and neither should your support team.”
Equally important is weaving intelligent automation into operations. The goal is to minimize human toil and error in routine monitoring and remediation. Modern NOC teams leverage tools and runbook automation so that the easy problems fix themselves. For instance, if a link goes down or a virtual desktop server becomes unresponsive, automated workflows can detect the anomaly and instantly attempt a predefined fix (like restarting a service or shifting load to a backup route). It’s not science fiction; these automations are in use today, buying back precious time for the operations team.
Intelligent automation is also the antidote to alert fatigue. By using machine learning to analyze the flood of telemetry, systems can filter the noise and surface only truly critical events. They learn what “normal” looks like and can ignore transient or low-impact anomalies. In practical terms, instead of waking up an on-call engineer for five separate alarms all caused by one underlying issue, an AI-informed platform might consolidate those into one high-priority alert with context – or even resolve it autonomously if it recognizes the pattern.
Resilience isn’t just about uptime – it’s also about safety and trust. One fundamental practice is role-based access control (RBAC) for all administration systems: only the right people have the right level of access to network devices, management consoles, and virtualization platforms. This reduces the chance of accidental misconfigurations and limits insider threats. Every action in the network should be audit–able.
Another key practice is maintaining redundant operations centers and infrastructure – the earlier mention of dual NOCs is not only for performance, but also a security measure. Geographic separation means even if one location is hit by a disaster (natural or cyber), the other can take over, ensuring continuity. Likewise, having redundant network paths, backup systems, and fail-safes is critical. It’s about eliminating single points of failure, whether that’s a piece of hardware or a human operator.
Finally, leading organizations (and the vendors that serve them) pursue industry compliance and certifications to enforce best practices. Frameworks like ISO 27001 for information security and SOC 2 for service organization controls provide structured approaches to keeping operations secure and reliable. For example, Anunta adheres to stringent security protocols – including data encryption, strong access controls, and compliance with industry regulations – to ensure a secure operational environment.
Decision-makers should look for these assurances. When your network and virtual desktop infrastructure is being managed by a partner or an internal team, you want to know that their security maturity is keeping your data and services safe. In short, security practices like RBAC, dual NOCs, and compliance certifications act as an insurance policy, fortifying the network operations against threats, and adding another layer of risk reduction.
A huge advantage in the new approach to network management is the wealth of analytics and insight that modern platforms provide. When you collect data from every layer – network, servers, applications, and end-user devices – you can mine that data for patterns and knowledge. Advanced analytics help answer questions like:
For example, today’s monitoring platforms often include real-time dashboards and historical trend analysis. Teams get customizable dashboards to visualize key performance indicators across the environment, making it easy to spot anomalies at a glance. Even more powerfully, some tools leverage machine learning on historical data to provide predictive analytics that forecast future needs or potential failures[18]. If the system sees that network traffic for a certain branch office is growing 10% every week, it can project when that link will max out – prompting you to upgrade capacity before users complain.
Proactive analytics don’t just help in incident response; they also support continuous improvement. By analyzing trends, IT teams can pinpoint chronic problem areas – perhaps a particular office network that experiences frequent blips, or an application that needs optimization for better performance on virtual desktops. Over time, these insights drive strategic fixes and investments that improve reliability and performance across the board. In essence, analytics and proactive response systems transform the NOC from a passive watcher into an active guardian of network and user health.
Bringing it all together, what does a resilient network operations model look like? It’s one where complexity is mastered through comprehensive observability, where issues are caught early (or headed off entirely) thanks to 24×7 intelligent monitoring and automation, and where robust security underpins every action. It’s a far cry from the old break-fix mentality. Instead of reacting to fires, IT teams operate in a continuous improvement loop – learning from every incident, leveraging data to prevent the next, and aligning network performance to business needs.
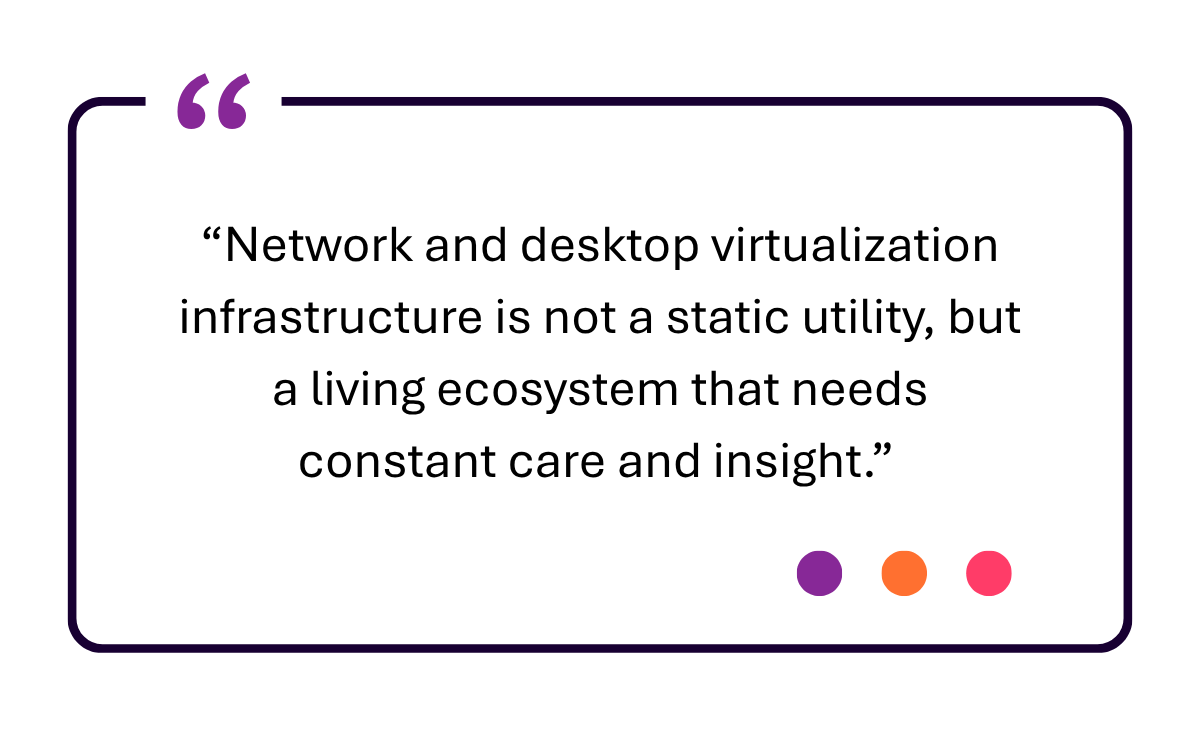
For decision-makers, adopting this mindset means recognizing that network and desktop virtualization infrastructure is not a static utility, but a living ecosystem that needs constant care and insight. It may require investing in new platforms or managed services, but the payoff is tangible. By shifting from reactive to resilient network management, organizations can dramatically reduce downtime and its associated costs, as well as lower the day-to-day stress on IT staff. The end result is a network (and by extension, a business) that bounces back from disruptions quickly – or avoids them outright – while delivering a reliable experience to users and customers.

In summary, the journey to resilience involves tackling the common pain points head-on: tame the complexity with full visibility, defeat alert fatigue with smart automation, minimize downtime through proactive operations, and mitigate risk with baked-in security. As seasoned professionals will attest, this evolution is not just about technology, but also about culture and processes. It’s about empowering your IT teams with the right tools and the right approach so they can move from firefighting to strategic enablement. In a world where digital services are the lifeblood of enterprise success, making this shift is key to staying competitive and confident.
The future of network operations is proactive, intelligent, and resilient – and it’s a future well worth pursuing for any organization embarking on desktop virtualization or network modernization.
Our Day 2 Services help enterprise IT teams move beyond setup and into long-term success — with proactive monitoring, automation, and user experience insights that keep your virtual desktop and network environments running smoothly.
Research Review with Anunta’s CTO | Jan 14 | 12PM PST/3PM EST